The Media Insights module in the Lift ROI platform allows users to drill into their marketing data with high granularity and flexibility. By adjusting filters, selecting KPIs and interacting with graphs and tables, users can extract actionable insights for optimising media investment.
TABLE OF CONTENTS
1. Analyse Media Performance Over Time
Scroll to the Media Performance Over Time section.
A graph will display selected KPI trends across time.
1.1 Adjust the Graph View
Zoom in or out using the control button.
Navigate left or right using the arrow buttons.
1.2 Change Time Granularity
Click on the granularity dropdown.
Choose from: Daily, Weekly, Monthly or Quarterly.
The graph will adjust based on data availability.
1.3 Select Metrics to Compare
Use the dropdown above the graph to select KPIs:
Media Investment vs Media Generated Tickets
Media Investment vs Media Generated Profit
Media Investment vs ROI
Cost per Action vs Media Generated Tickets
Note that availability of KPI depends on the data availability.
- Hover over any point in the graph to view detailed values:
Note that values viewed depends on the chosen time granularity.

2. Review Media Performance Summary
Scroll to the Media Performance Summary section.
View a table summarising performance metrics across media dimensions.
2.1 Modify Hierarchy Display 
Click on the Hierarchy widget.
Reorder the display sequence as per requirement:
Default: Media Grouping > Campaign > Channel > Creative Format > Publisher or as per organisation's request.
You may drag and drop to change the order (e.g., You can make Campaign the top level).
You may unselect a particular driver as well.
2.2 Understand Summary Columns
The KPIs displayed are as per organisation's request.
Media Investment: Total media spend in the selected period.
Media Generated Tickets
Media Generated Profit
Cost per Action
Return on Investment (ROI)
2.3 Interact with Data
Click on column headers to sort column contents in ascending or descending order.
Click on a media driver (e.g., Television) to drill down.
The lower performance data table updates accordingly, displaying deeper insights.

3. Explore the Media Performance Data Table
Scroll to the Media Performance Data Table section.
This section offers a detailed breakdown of the same metrics as in summary section but here in tabular form.
3.1 Expand Hierarchy Levels
Use the expand/collapse button to drill down to the required level:
Media Grouping → Campaign → Channel → Creative Format → Publisher
3.2 Review Publisher-Level Metrics
Example:
Paid Television > Brand Campaign > Television > Sponsorship > Publisher Name
3.3 Clean View Options 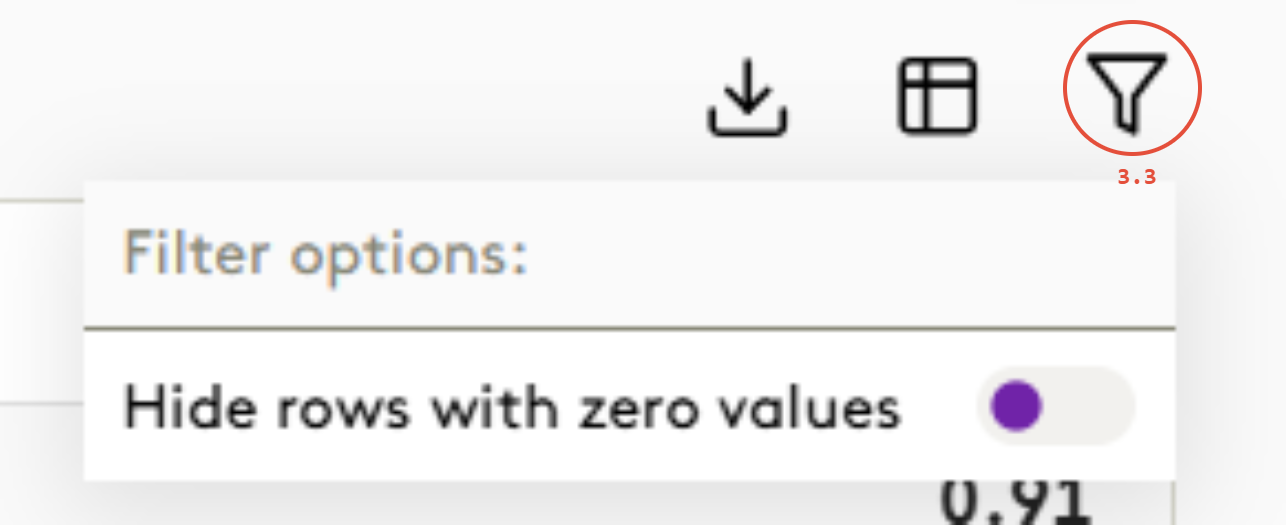
Click the option to hide rows with zero values.
Use the column customisation tool to:
Show or hide specific columns.
Reorder columns (e.g., display only Media Investment and ROI).


4. Export Data
Click the Export button.
Choose from two options:
Export Filtered View: Downloads only the visible/filtered data as a Excel file.
Export Full Dataset: Downloads all available data regardless of filters.
