This section describes how internal users can customise key settings for Portfolio Long-Term Models using the Admin Panel. These configurations determine how the model appears in the UI, what labels and dimensions are used, and how data is organised across different modules such as Media Insights, Business Insights, and Prediction.
TABLE OF CONTENTS
- How to begin?
- 1. Model-Level Settings
- 2. Portfolio Models
- 3. Media & Non-Media Visible Metrics
- 4. Visible Impact Dimensions
- 5. Short-Term & Long-Term Labels (Across UI)
- 6. Media Groupings
- 7. Business Groupings
- 8. Business Insights Minimum Interval
How to begin?
- Access the Admin Panel
Click the Admin Panel button on the top right → Select the Organisation → Choose a Portfolio longterm Model → Click New Draft to begin editing. - All changes made in draft mode must be saved and then taken to producion after thorough review.
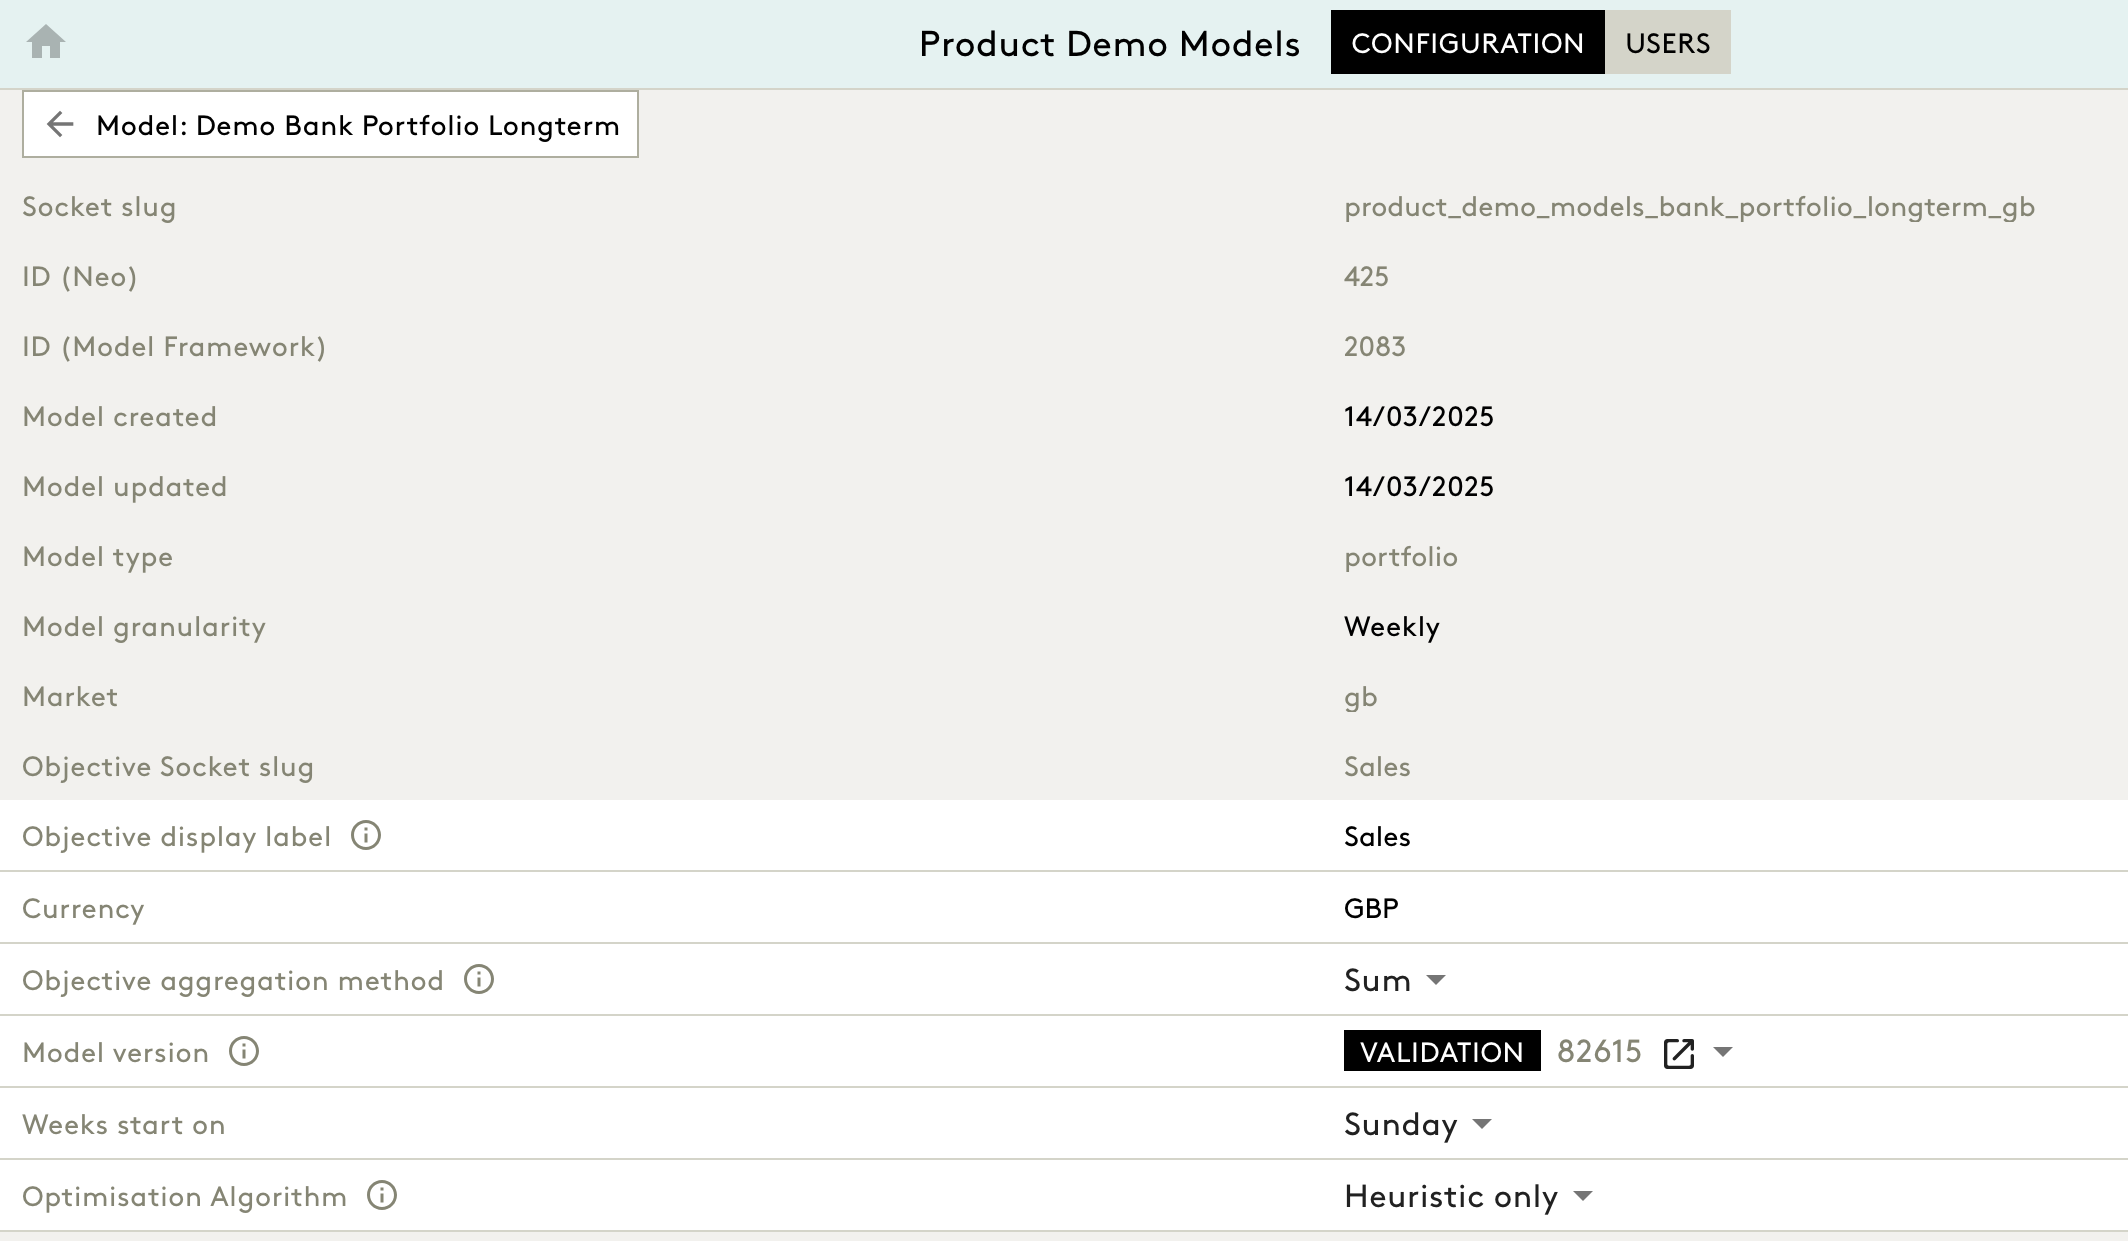
1. Model-Level Settings
These settings define the fundamental structure of your model instance and control the objective, currency, aggregation logic, and optimiser behaviour.
| Field | Description | Customisable? |
|---|---|---|
| Model Name | Displayed in the title | No |
| Socket Slug | System identifier | No |
| Model Type | Always set to ‘portfolio’ | No |
| Model Granularity | Typically ‘Weekly’ | No |
| Market | Country code (e.g., gb) | No |
| Objective Display Label | Label for the primary KPI (e.g., ‘Sales’) shown across UI | ✅ Yes |
| Currency | Display currency (e.g., GBP, USD) | ✅ Yes |
| Objective Aggregation Method | Choose ‘Sum’ or ‘Average’ to compute the objective | ✅ Yes |
| Weeks Start On | Define start day of the week (e.g., Sunday) | ✅ Yes |
| Optimisation Algorithm | Select between ‘Heuristic only’ or ‘CBC only’ | ✅ Yes |
2. Portfolio Models
This section allows you to configure model selector button labels and set colours and labels for product variants.
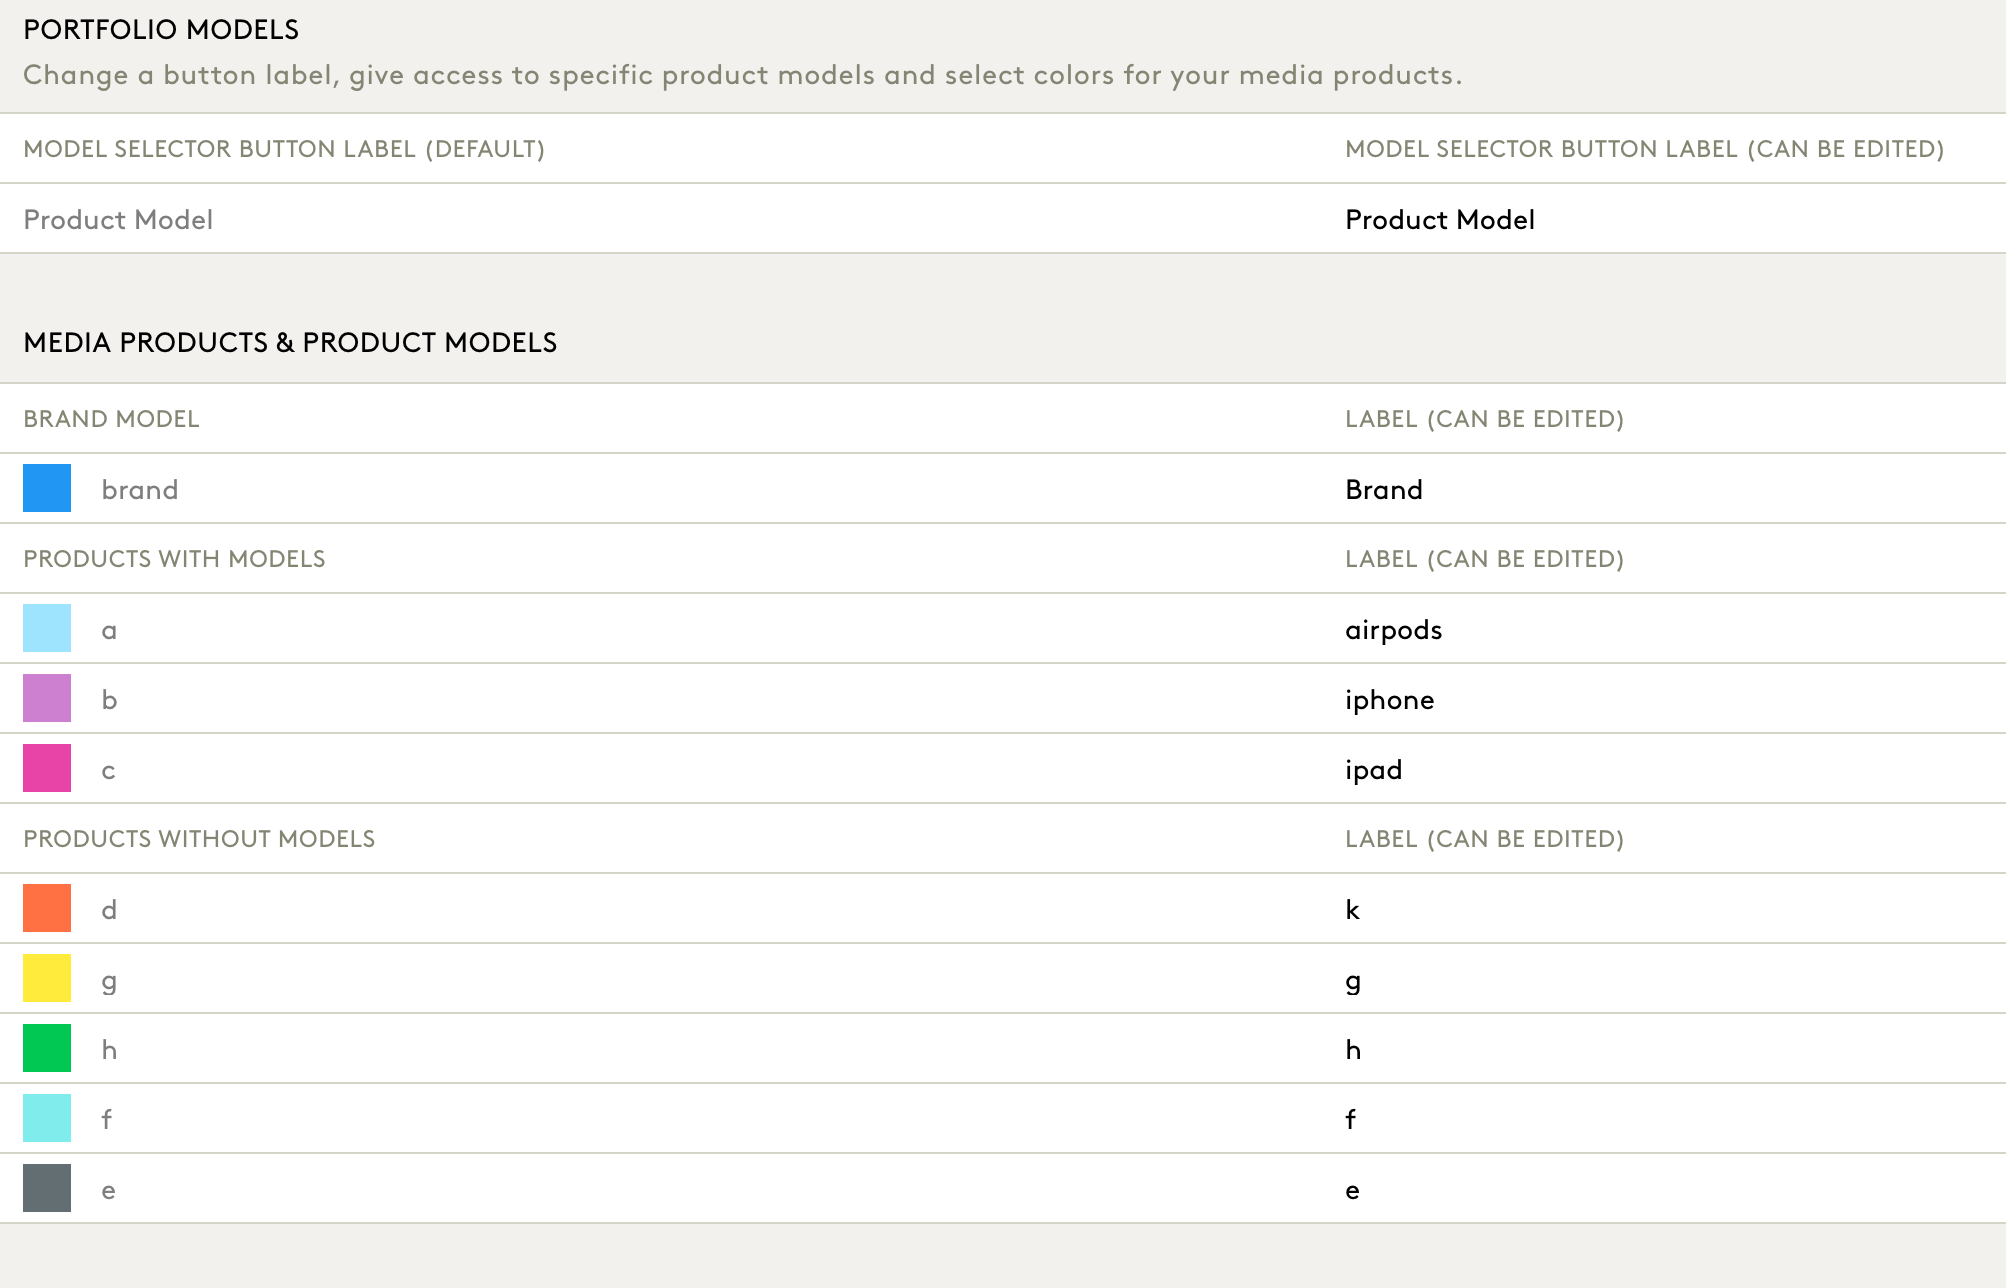
Editable Elements:
- Model Selector Button Label – Change the label seen in the top toggle buttons.
- Products with Models – Assign names and colours to products that have modelling outputs (e.g., ‘iphone’, ‘airpods’).
- Products without Models (Halo) – Label other variants even if they don’t have model outputs (e.g., ‘g’, ‘h’).
This impacts how the products appear in the Media and Business Insights modules.
3. Media & Non-Media Visible Metrics
This controls which KPIs are displayed across Media Insights, Prediction, and Activity modules, and how they are labelled in the UI.
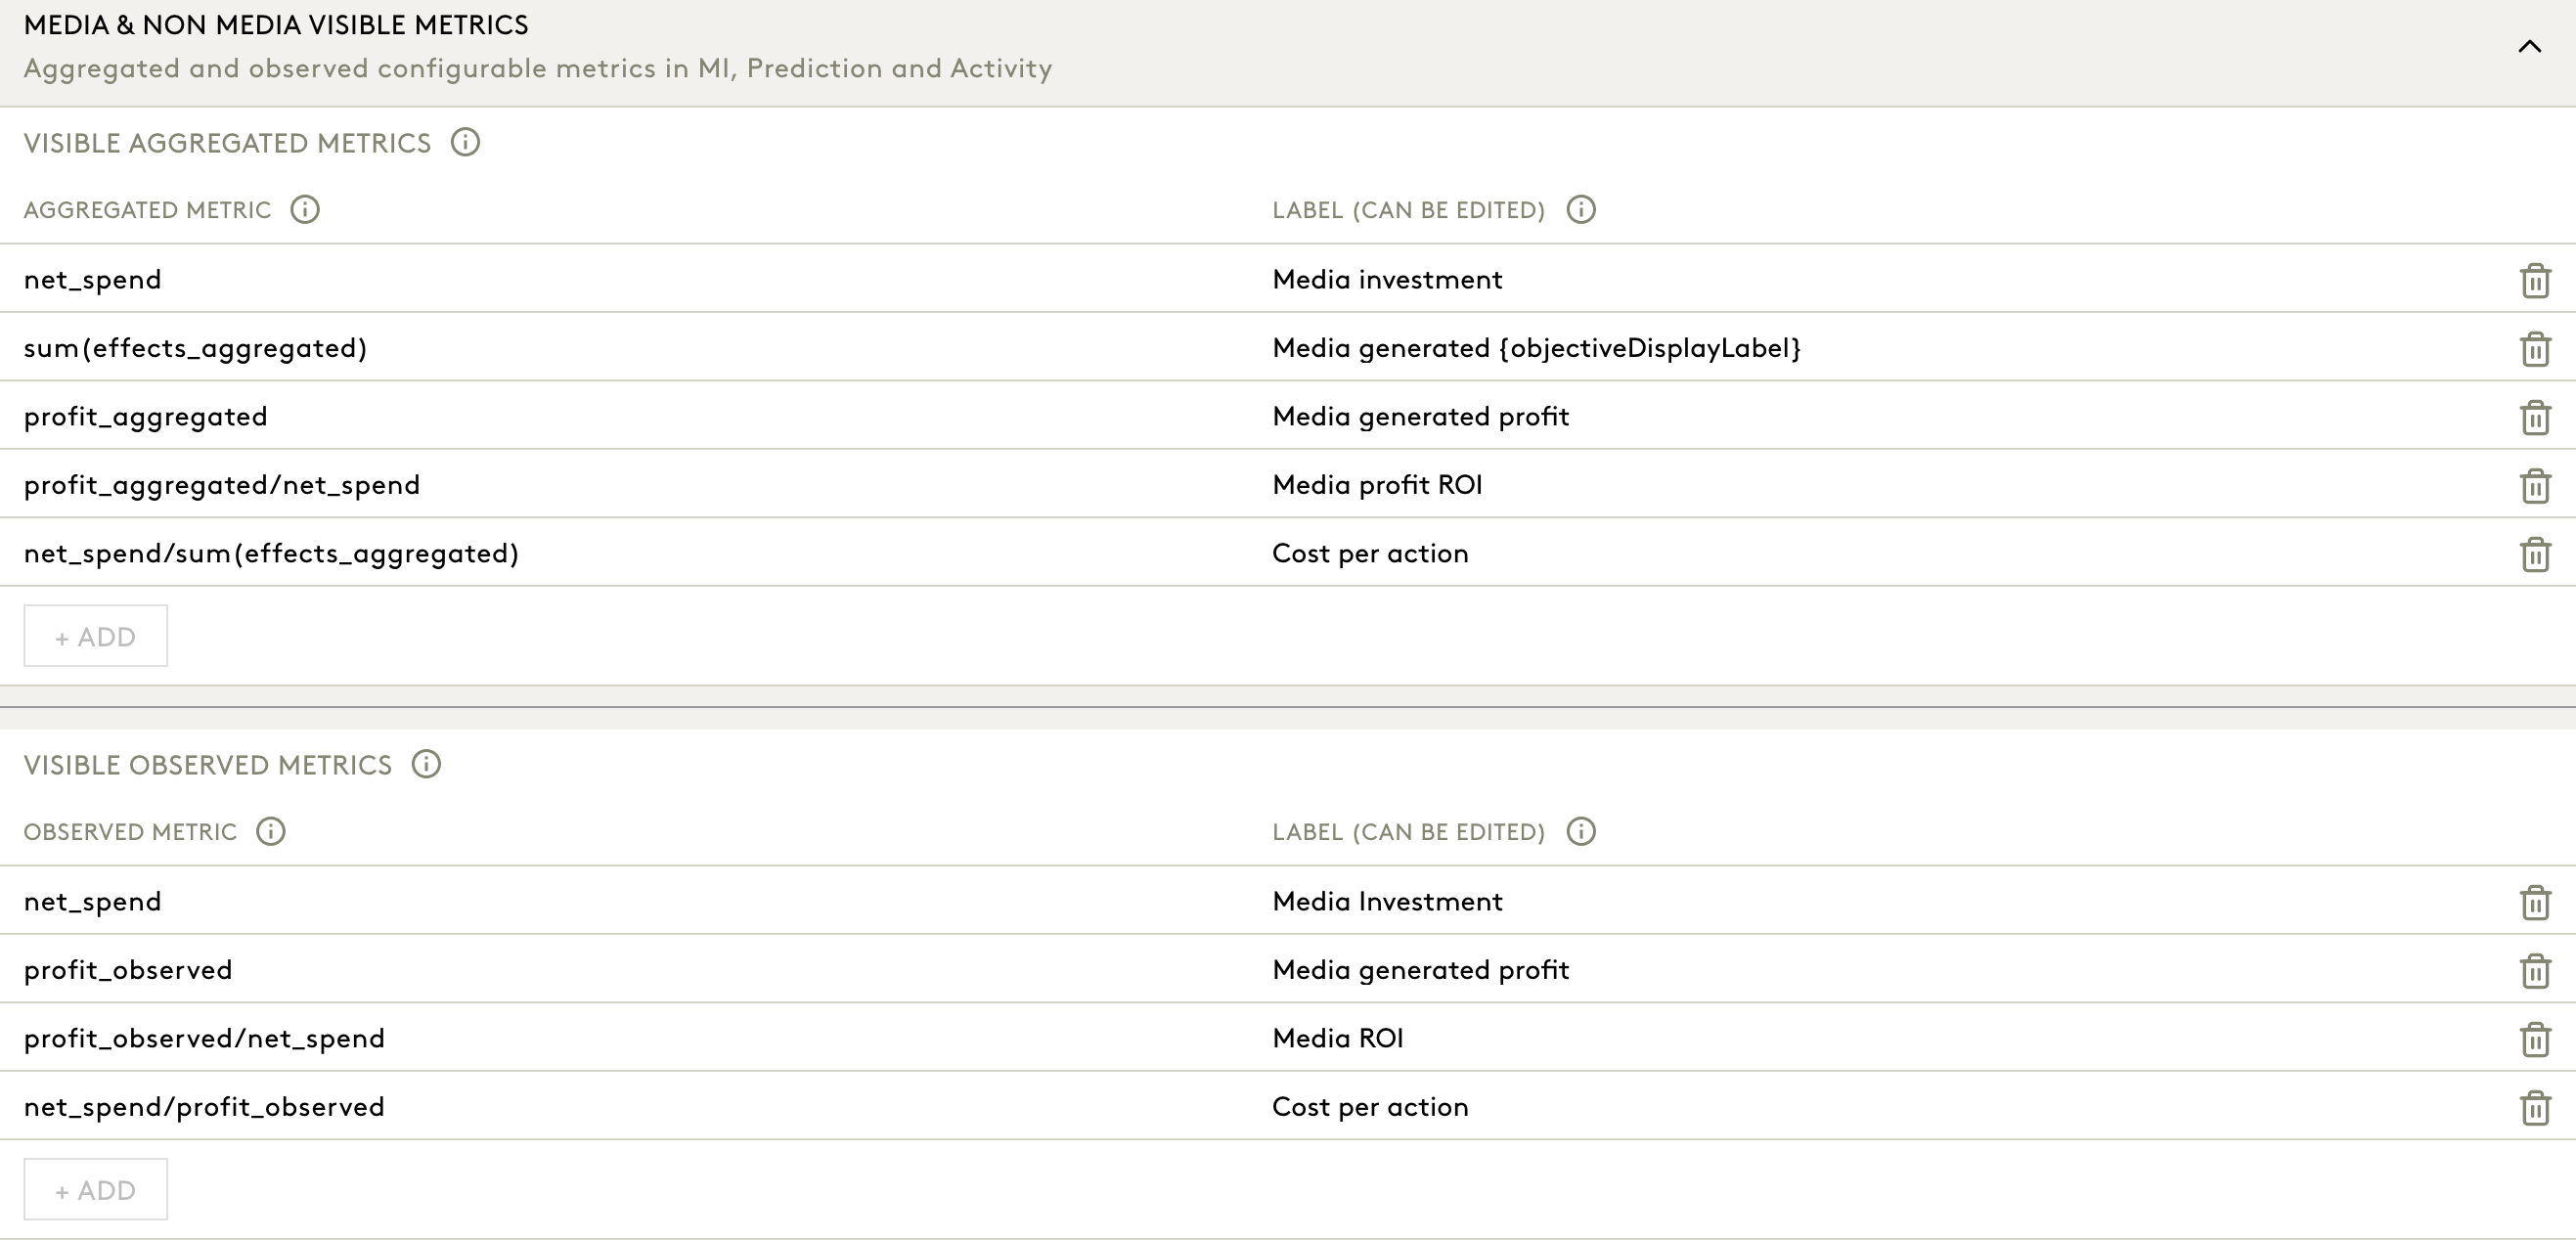
3.1 Aggregated Metrics
Used for model-predicted metrics.
You can add, delete and find Editable labels for:
- Media investment (
net_spend) - Media generated (objectiveDisplayLabel) (
sum(effects_aggregated)) - Media generated profit (
profit_aggregated) - Media profit ROI (
profit_aggregated / net_spend) - Cost per action (
net_spend / sum(effects_aggregated))
3.2 Observed Metrics
Used for actual performance data (e.g., observed profit)
You can add, delete and find Editable labels for:
- Media Investment (
net_spend) - Media generated profit (
profit_observed) - Media ROI (
profit_observed / net_spend) - Cost per action (
net_spend / profit_observed)
Tip: Use clear, user-friendly names as per client's requests.
4. Visible Impact Dimensions
Defines which dimensions are used to break down media impact in the Media Insights, Prediction & Activities module.
Editable per effect type:
- Short-term direct (st_direct)
- Short-term indirect (st_indirect)
- Long-term indirect (lt_indirect)
- Combined
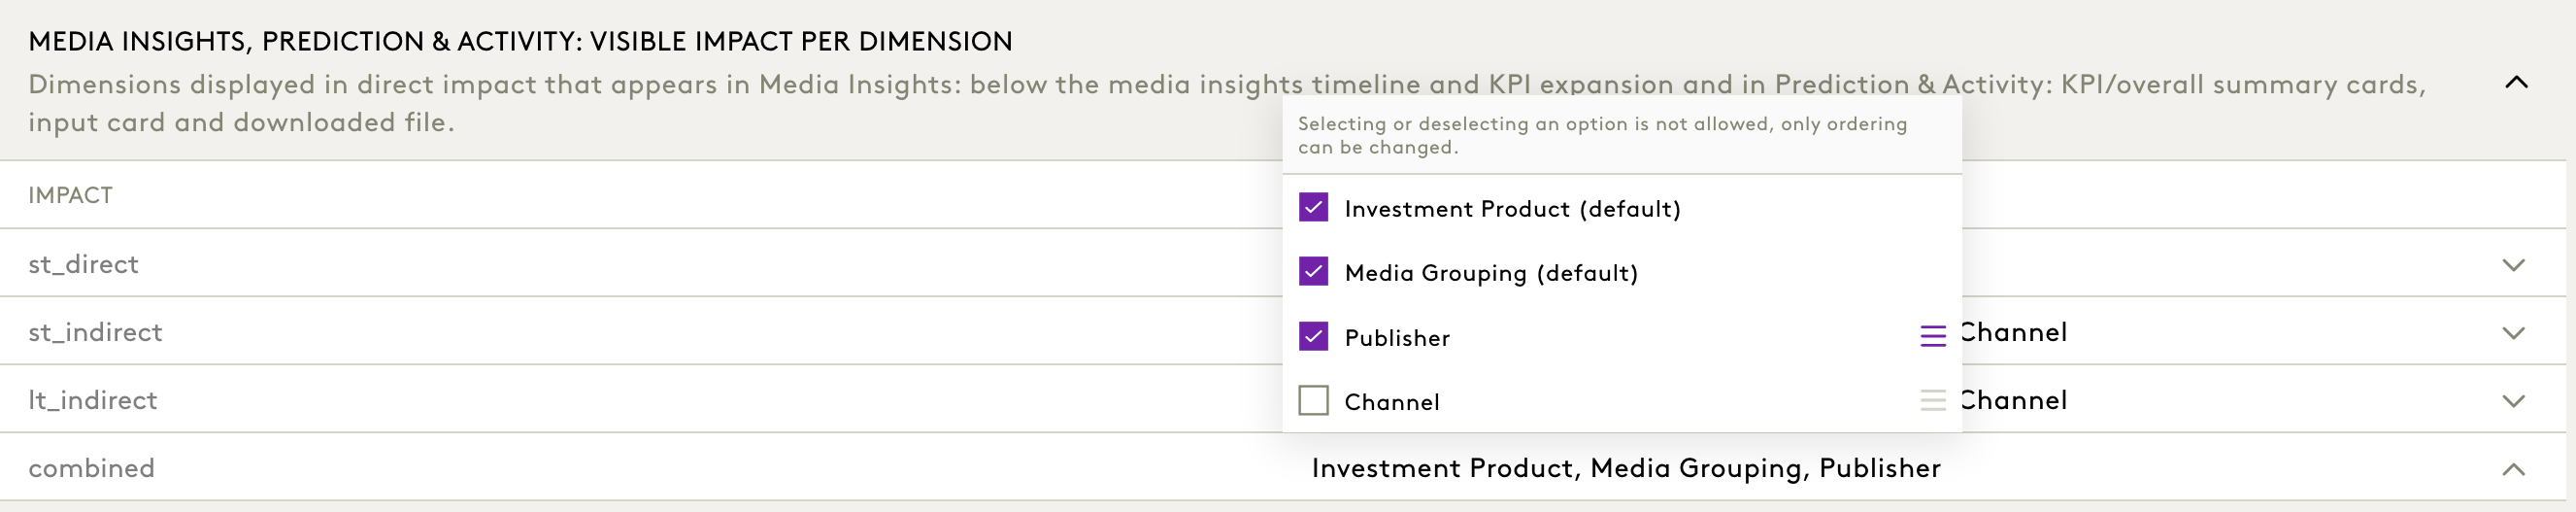
For each, you can select dimensions such as:
- Investment Product
- Media Grouping
- Publisher
- Channel
This determines how driver bars and legends appear in impact graphs and cards.
5. Short-Term & Long-Term Labels (Across UI)
You can change the display label for effect types shown in buttons, table headers, and legends.
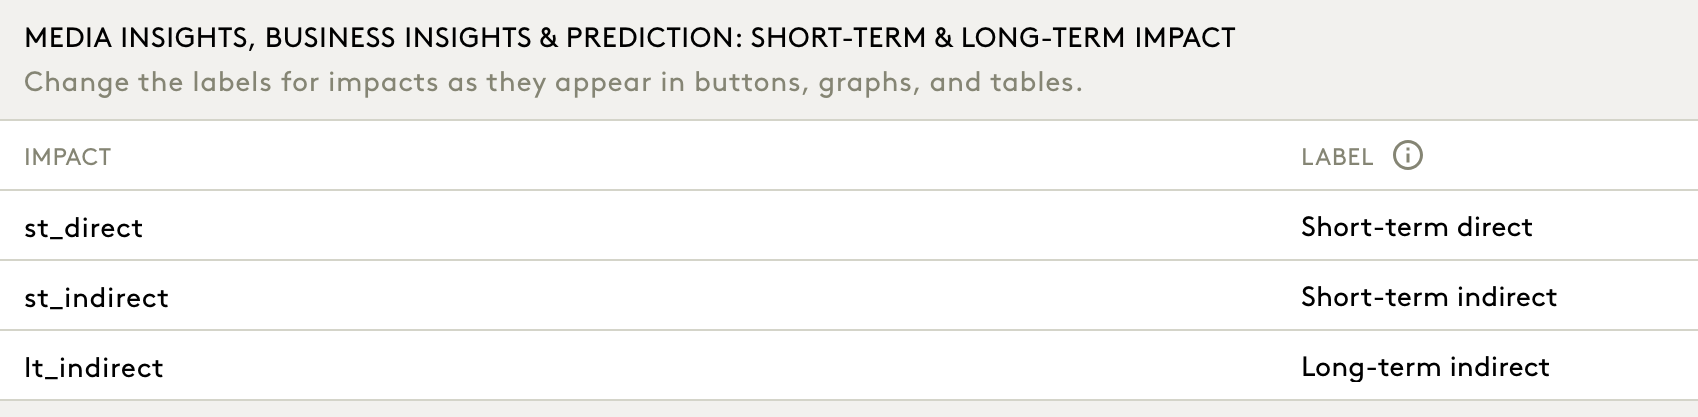
Editable fields:
- st_direct → e.g., "Short-term direct"
- st_indirect → e.g., "Short-term indirect"
- lt_indirect → e.g., "Long-term indirect"
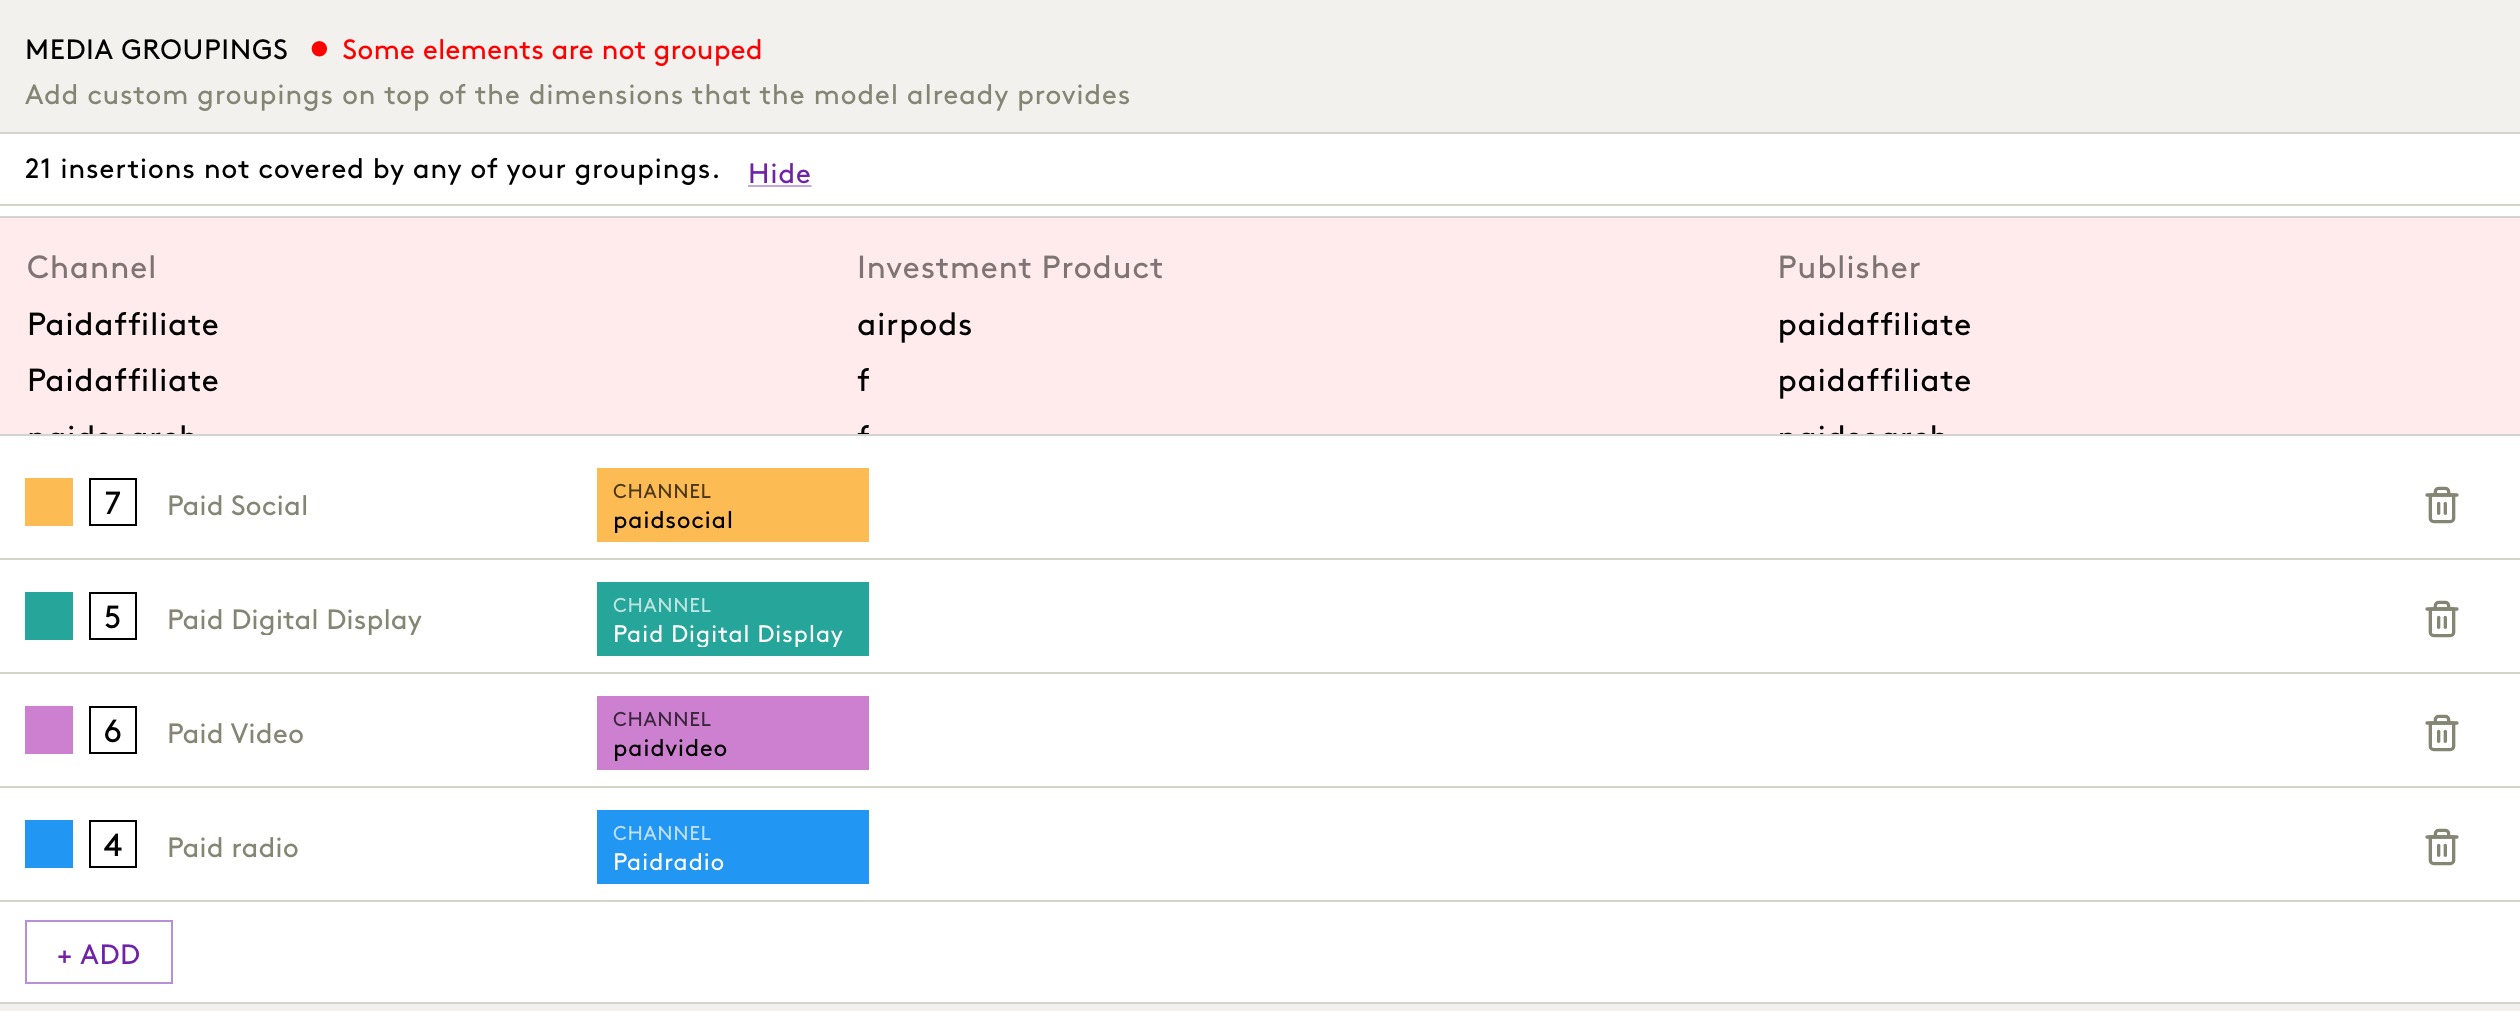
6. Media Groupings
Configure custom grouping of individual media insertions.
Each grouping includes:
- Group Name (e.g., ‘Paid Social’, ‘Paid Print’)
- Channels Included (e.g.,
paidsocial,paidprint)
These groupings power:
- The legend and driver groupings in Media Insights
- The drilldown capability in cards and tables
To configure media groupings:
- Edit the group name by clicking directly on the label (e.g., “Paid Social”). You can rename it to suit the naming conventions of your organisation.
- Change the colour associated with the grouping by clicking on the coloured square. This colour will appear across visualisations and legends.
- View the list of insertions included in the group by clicking on the number displayed beside the group name. This helps in reviewing coverage and content.
- Assign insertions to the group by clicking on the CHANNEL tile. You can select the relevant Channel, Investment Product, and Publisher values from dropdown menus.
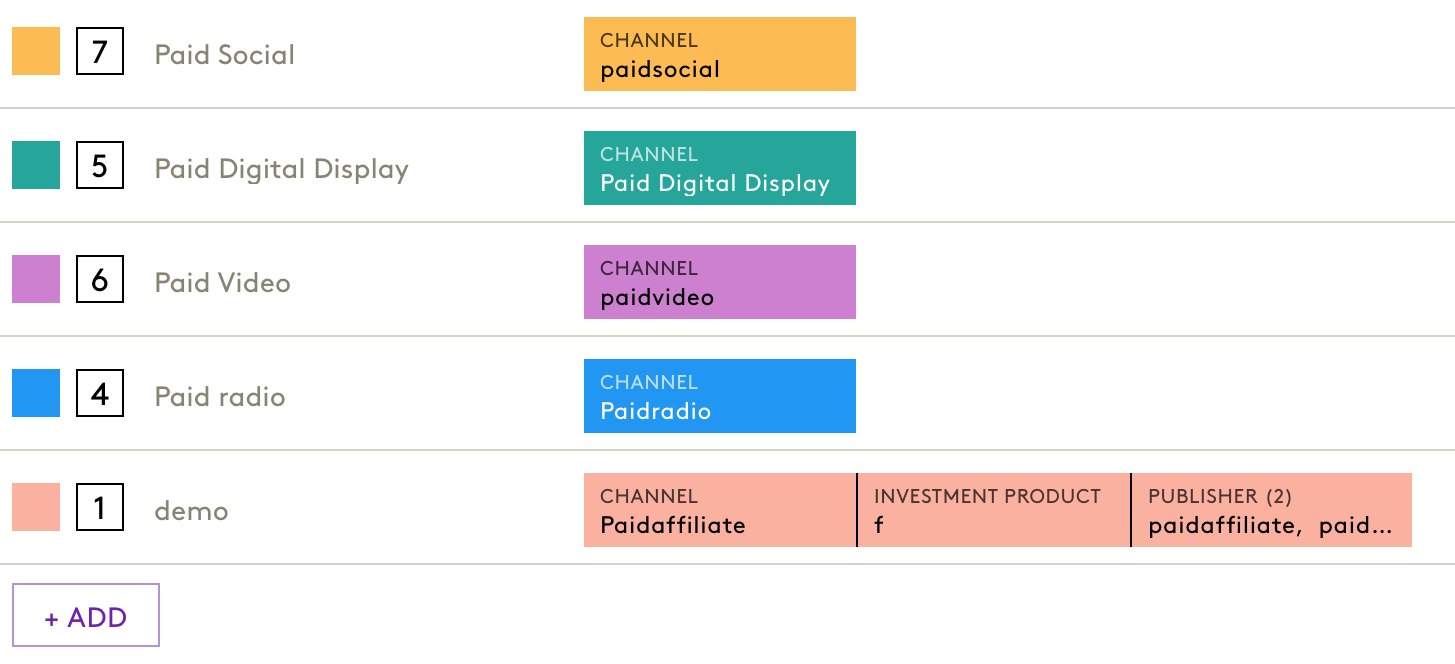
- Add a new grouping using the + ADD button at the bottom of the section.
If any insertions are not currently part of a group, a warning appears at the top of the section:
“Some elements are not grouped.” Click Hide or Show to expand the list of ungrouped insertions and take corrective action.
It is important to ensure that all insertions are included in at least one grouping for accurate tracking and reporting within Media Insights and related modules.
7. Business Groupings
Used in Business Insights for aggregating non-media drivers.
Each business grouping has:
- Label (e.g., ‘Organic Activities’, ‘Brand Index & Base’)
- Associated Drivers (e.g.,
Organic_activities,Brand_index_base) - Optional Dimension Breakdown (e.g.,
Product,Media Grouping)
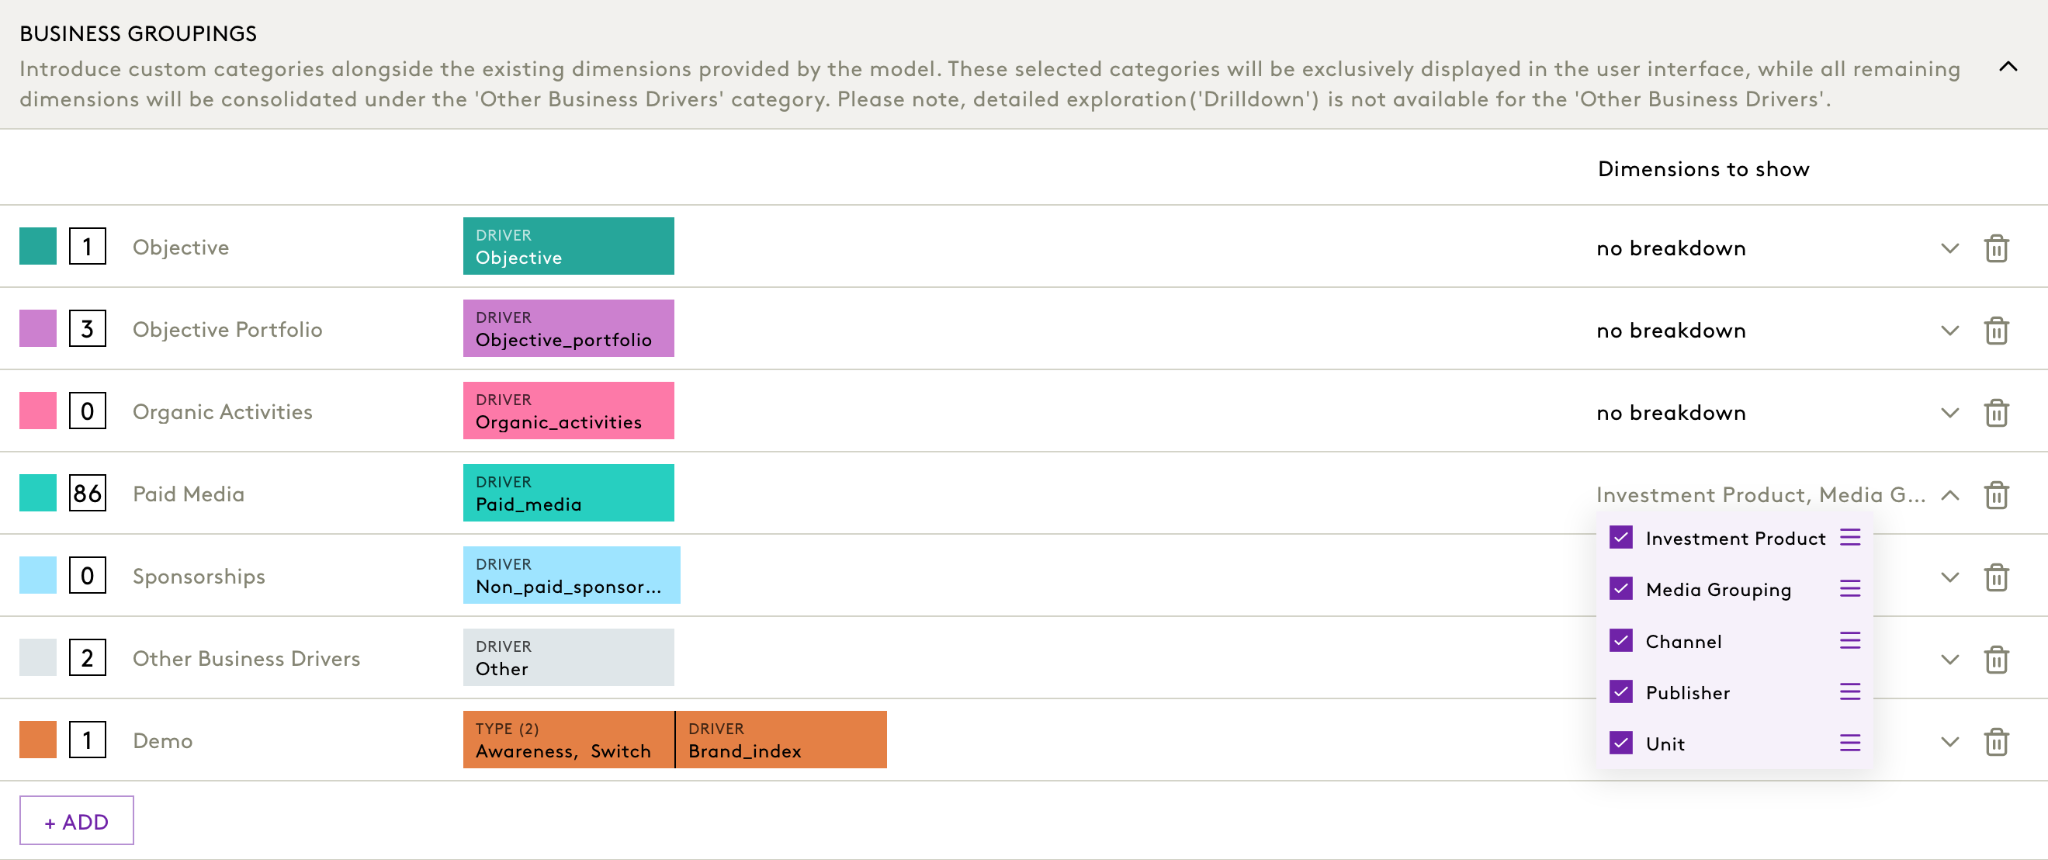
To configure business groupings:
- Edit the group name by clicking on the text label (e.g., “Paid Media”) to reflect business-relevant terminology.
- Change the group colour by clicking on the colour block. This will be used in all charts and legends across the platform.
- Review the number of insertions included within the grouping by clicking the number on the left.
- Click on the DRIVER block to assign drivers (model inputs) to the group. You may assign one or more inputs of the same type here (e.g.,
Organic_activities,Objective_portfolio, etc.). - Specify dimensions to show using the dropdown under Dimensions to show. This controls how breakdowns are displayed in tables and charts within the Business Insights module. Options include:
- Investment Product
- Media Grouping
- Channel
- Publisher
- Unit
- Add a new grouping using the + ADD button at the bottom of the section.
Grouped drivers will appear separately in platform outputs, while all other model drivers will be grouped under Other Business Drivers.
Business groupings appear in the waterfall, treemap, and contribution views of Business Insights.
8. Business Insights Minimum Interval
Controls the lowest granularity available in the Business Insights timeline.
- Options: Weekly or Monthly
- Affects: Bar chart granularity and export granularity

Last deployment information appears at the bottom (user + timestamp). |